
Delivering Solutions | The Developer
It’s clear from this list that the new Mapbox features in Power BI cater to both the developer and the end user. As a Power BI Developer, the ability to autozoom to selected shapes will certainly reduce the amount of time and energy spent turning multi-geographic level dashboarding into a seamless user experience. With this new feature, relevant geographic information is both at the finger-tips and in the direct line of sight of the user. Time and resources are also saved through the smarter tooltip, which auto-formats the Tooltip with the visual’s Dimension’s format. In addition, the Power Bi Developer will be able to better control the User Experience of the dashboards through the setting of Map Pitch (Relevant to 3D Extrusions), and by disabling the Mapbox map controls. While it is important to allow a user freedom in the exploration of their data, it is also a vital responsibility of the developer to define the bounds of exploration which deliver focused insights.
Extracting Insights | The End User
Not only does this update simplify some of the Power BI Developer’s tasks, but it will also create a more enriching experience for the end user. For example, the addition of 3D Extrusions allows the user to analyze an additional dimension of data. Navigating across dashboards to detect the signal from the noise in geographical data can be tedious, time consuming, and, often, unfruitful. Through 3D Extrusions, the visualization of physical space and its relevant data dimensions come together in one place, delivering more information, and uncovering deeper insights. Additionally, the Power BI user will be excited to know that they can now navigate their Mapbox visuals more efficiently through the added search bar. In reality, the number of employees responsible over the entire geographic scope of a business’s data are few. More often than not, a user will be responsible for subsets of geographic data that requires quick navigation to specific information… Again, Thank you Mapbox!
Favorite Feature | 3D Extrusions
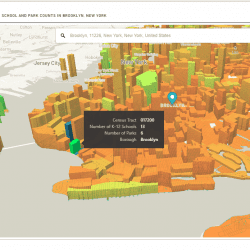
The addition of 3D Extrusions to the Mapbox Visual in Power BI provides a unique way for data analysts to visualize and tell compelling stories with their data. As a result, I couldn’t help but play around with the new visual and explore its features and usability myself. Below is an example of a 3D Extrusion that I created to visualize and compare the number of K-12 schools and public parks in Brooklyn, New York. In this visualization, we can clearly see the contrast between the number of parks in Brooklyn, indicated by the color of the Census Tract (More Green = More Parks), and the number of K-12 Schools in Brooklyn, indicated by the extrusion height of the Census Tract (Higher Extrusions = More Schools). This multidimensional view allows us to efficiently identify the Census Tracts with the greatest number of schools, the most parks, as well as make a comparison between the two counts.

The 3D Extrusion visual does exceptionally well at bringing granular geographic data to life, so for this visualization, I created a shape file of all the Census Tracts in New York City. Doing so allowed me to create a Tileset and Map Style in Mapbox Studio that I could then use in Power Bi through the Mapbox API. The following link proved to be a valuable source in learning how to connect Power BI to custom Mapbox Tilesets and Styles and will hopefully be an aid to help you create 3D Extrusion Maps of your own!
If you’re interested in staying up to date with Power BI, Mapbox, and other tools and services in the analytics space, check back in to the Syntelli Blog soon!
The original announcement of these new Mapbox features in Power BI can be found at the following link: https://blog.mapbox.com/six-new-features-for-mapbox-visual-for-power-bi-472e9e1d3998